Analytics
The Analytics page gives you a full picture of how your AI employees are performing — from high-level daily summaries to message-level quality analysis. Open it from the left sidebar.
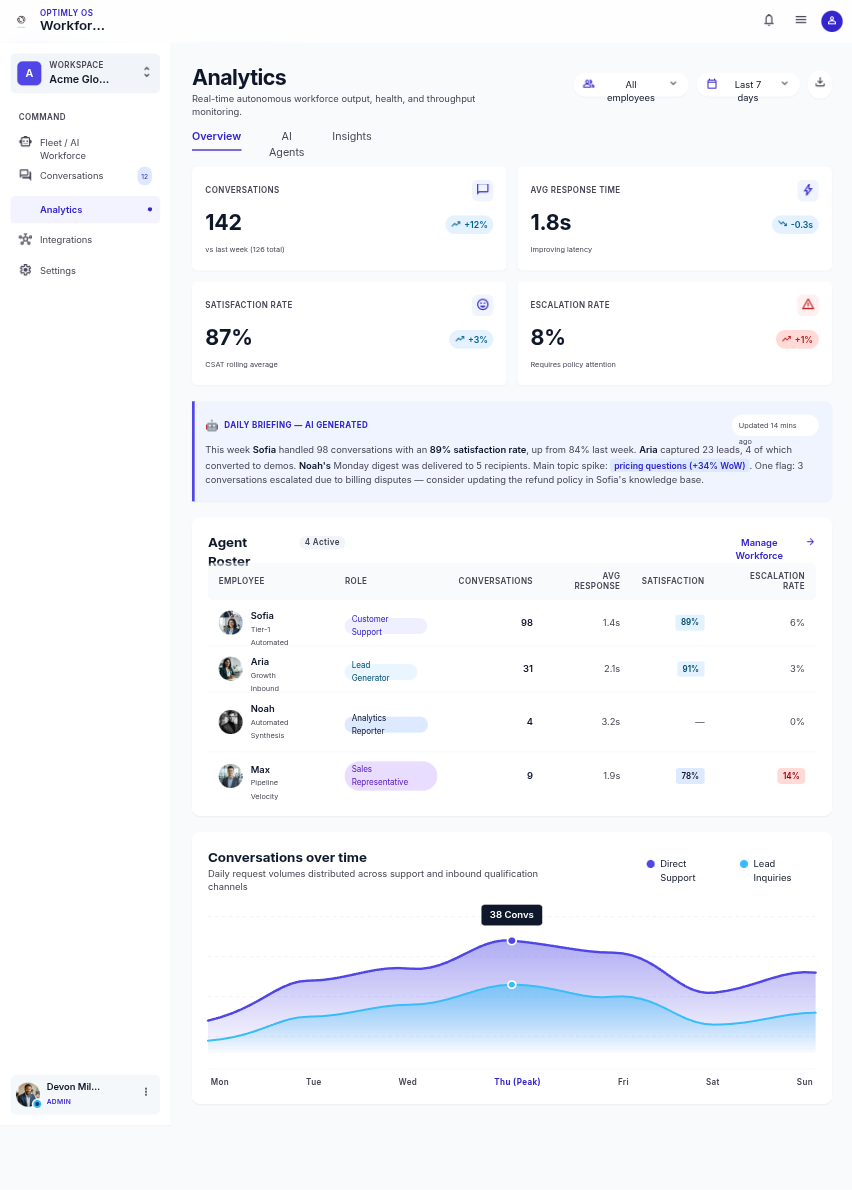
Daily Briefing
The Daily Briefing is an AI-generated summary at the top of the page. It synthesizes your conversation data into a concise read for the selected date range:
| Metric | What it shows |
|---|---|
| Conversations | Total conversations handled across all employees |
| Leads | Total leads captured |
| Appointments | Appointments booked |
| Escalations | Conversations handed to a human |
The briefing also surfaces notable patterns — spikes in a topic, a drop in satisfaction, an employee that's performing unusually well or poorly — so you don't have to dig to find what matters.
Agent Roster
Below the Daily Briefing is a table of all your AI employees and their key performance metrics for the selected period:
| Column | Description |
|---|---|
| Conversations | Total conversation count |
| Avg response time | Mean time from customer message to employee reply (milliseconds) |
| Satisfaction rate | Average customer rating (1–5 stars) as a percentage |
| Escalation rate | Percentage of conversations handed to a human |
Click any employee row to filter all charts on the page to that employee only.
Overview Panel
The Overview Panel has area charts and metric cards showing trends over time:
- Conversations over time — area chart with daily/weekly breakdown
- Top emotions — dominant customer sentiment per conversation (e.g. Curious, Frustrated, Satisfied)
- Topic distribution — what subjects customers are asking about most
Use the date range filter (top right) to set the analysis window: last 7 days, 30 days, or a custom range. Use the employee filter to focus on one employee.
Analytics tabs
The full analytics page has four tabs:
| Tab | What's here |
|---|---|
| Overview | Daily Briefing, Agent Roster, conversation trends, emotions |
| Quality | Response quality scores, RAG effectiveness (how well knowledge sources are used), tool usage |
| Conversations | Searchable table of every conversation with metrics columns; click a row for the full thread |
| Anomalies | Automatically flagged conversations — unusual patterns, repeated failures, negative sentiment spikes |
Key metrics explained
Satisfaction rate — derived from in-conversation customer ratings. A rating of 4–5 is counted as satisfied. Low satisfaction on a specific employee usually means its knowledge base needs updating or its instructions need tuning.
Escalation rate — percentage of conversations where a Colleague was invoked or Manual Mode was toggled. Some escalation is healthy (it means your employees are correctly routing complex cases). Very high escalation means the employee's knowledge or instructions are insufficient.
Avg response time — how quickly the employee replies after a customer message. Spikes here usually indicate LLM latency or complex tool calls.
RAG effectiveness — on the Quality tab, this shows how often the employee found a relevant answer in its knowledge base vs. falling back to general training. Low RAG effectiveness means your knowledge base needs more content.
Sub-pages
The analytics sub-pages go deeper on specific aspects:
- Overview metrics — all metric definitions
- Message-level metrics — per-message analysis
- Intent & topic analysis — what customers are asking
- Response quality — accuracy and helpfulness scores
- Anomalies & flags — automatic problem detection
- Document usage — which knowledge sources are referenced most
- Export & reports — download data and schedule email reports
- Comparisons — compare employees or time periods
Related
→ Conversations page — live conversation monitoring
→ Agent configuration — tune behavior based on analytics findings